
US Health Data App
The National Health and Nutrition Examination Survey collects data in two-yearly cycles.This data contains important health measurement information from samples of the US population such as:
- Body Measurements:
- Body Mass Index, Weight, Height, Blood Pressure, etc ...
- Daily Nutrient and Diet intake:
- Energy Consumption, Carbohydrates, Protein, Sodium, etc ...
It is potentially useful to visualize changes for these measurements throughout time. As such, an Rshiny web application was created that allows users to visually explore these measurements of health in the American population since the year 2000.
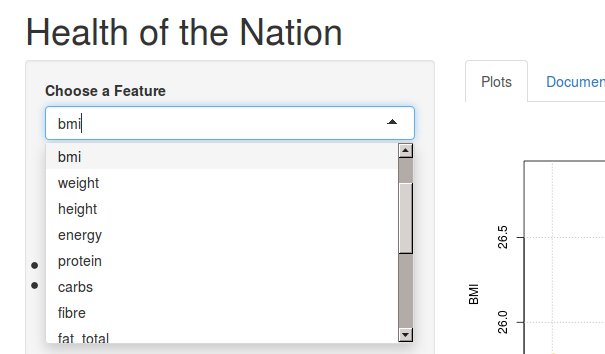
The application includes a drop-down menu that allows you to select the measurement you want to visualize.
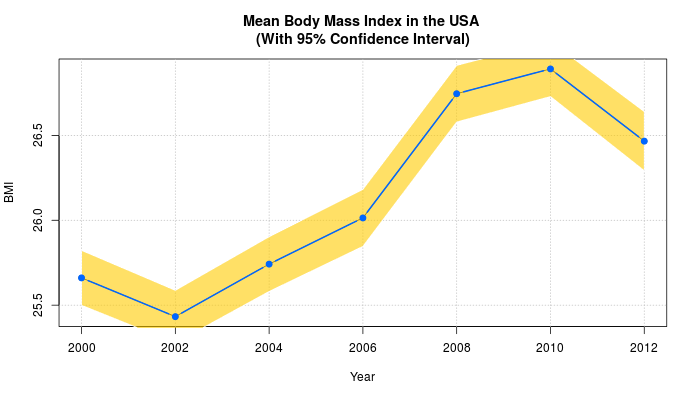
The app allows you to visualize the data both as a time-series plot as well as a distribution of the sampled data. The time series plot contains a shaded confidence interval allows you to infer whether such changes can be attributed to sampling variation alone, or if it reflects actual changes in the population.
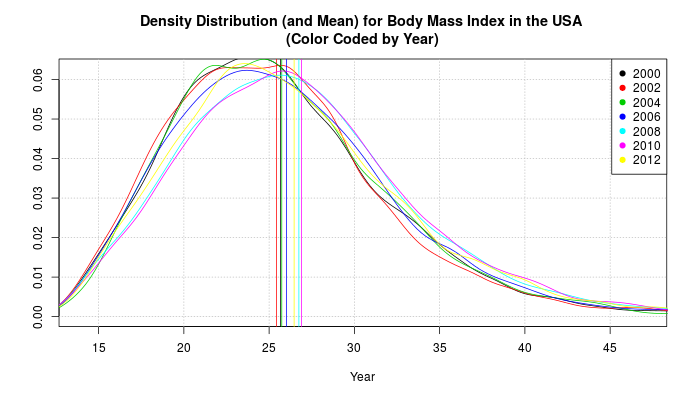
The density distributions plot allows you to see how spread out the data is about the mean, and how skewed it is.
A live demo and source code can be viewed with the following links:
Credits
- Banner image thanks to stevepb at pixabay.